
Chapter 5
Analytics and AI insight
The Analytics tab shows why customers return — across the store and down to product level — and suggests concrete actions.
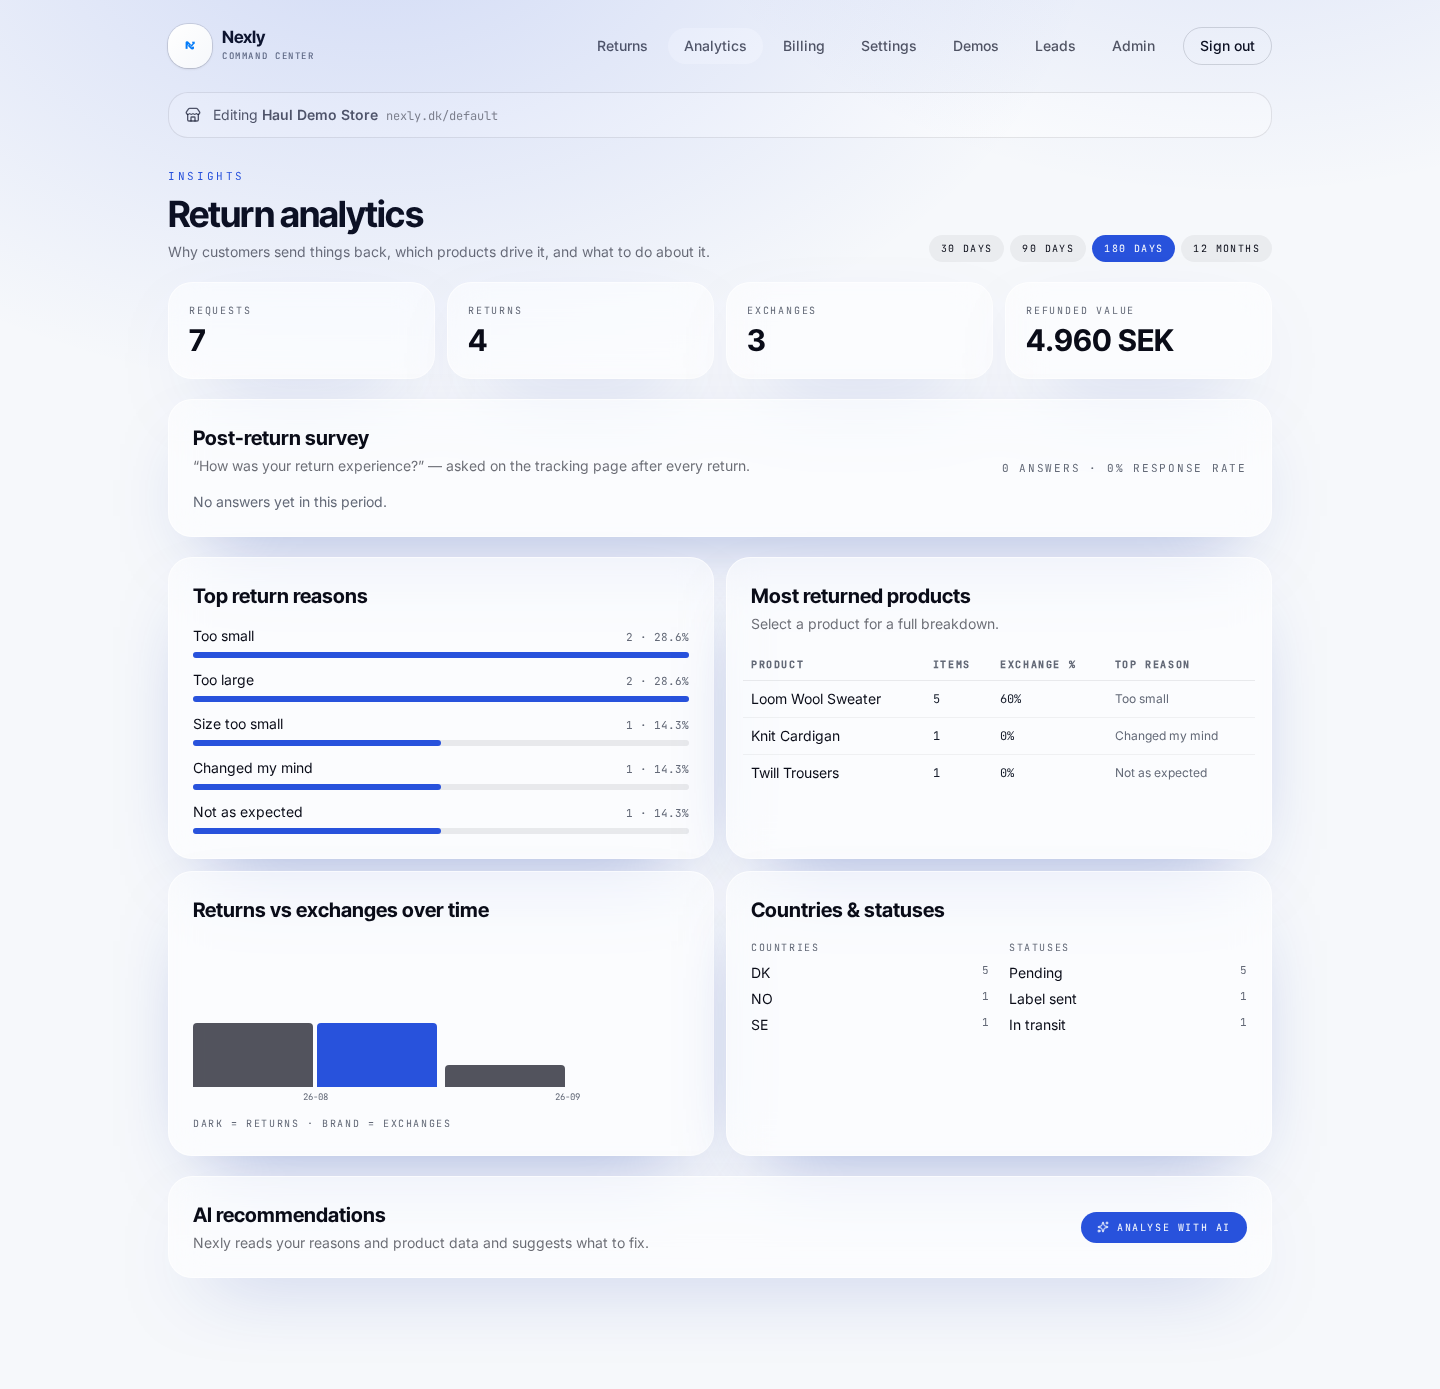
Key numbers and reasons
The top shows return rate, exchange share, average handling time and the distribution of return reasons for the period. Change the period to compare campaigns and seasons.
Product level
The list ranks products by return rate and shows the dominant reason per product. Drill into a product to see variants, reason split and customer comments — usually the fastest payback is a size guide or a swapped image.
AI recommendations
Nexly reads reasons, comments and survey scores and writes concrete recommendations: which products need a size-guide fix, which descriptions mislead, and where an exchange nudge moves the most revenue.
Customer satisfaction
The Return experience panel shows average score, response rate and the split between promoters and detractors — so you can see the effect when you change rules or carriers.